SVG
From Dietrich Blog (Strato)
Contents
SVG Scalable Vector Graphics
- SVG ist ein auf XML beruhender W3C-Standard für VektorGrafik.
- SVG 1.0: 2001
- SVG 1.1: 2003
- SVG 1.2: 2005
- SVG wurde sehr stark von der Firma Adobe unterstützt. Zum 1.1.2008 hat Adobe "End of Life" verkündet.
- SVG hat als offenes; d.h.nicht-proprietäres Format große Unterstützung durch OpenSourceSoftware
- SVG wird von MediaWiki unterstützt
- WebBrowser unterstützen SVG auch...?
- MozillaFirefox 2 unterstützt zur Zeit eine Teilmenge von SVG 1.1, diese soll in 2007 vervollständigt werden.
- Microsoft InternetExplorer ???
- Konkurrierend zu SVG ist: Flash von Macromedia (aufgekauft von Adobe)
Bekannte Probleme
- Darstellung von Pfeilspitzen an Linien
- Welche Schrifttypen werden unterstützt?
- Darstellung von Fließtext (ab SVG 1.2 möglich)
SVG Hello World Beispiel
So sieht der SVG Quelltext aus:
<?xml version="1.0" encoding="UTF-8" standalone="no"?>
<svg width="260" height="60">
	<rect x="10" y="10" fill="blue" width="240" height="40"/>
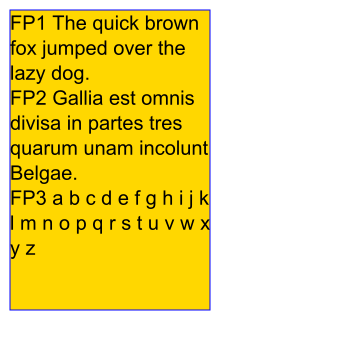
	<text x="40" y="40" style="fill:gold; font-size:20pt">
		Hello World!
	</text>
</svg>
Und so sieht die SVG-Grafik aus:

SVG Tools
- Sodipodi
- Inkscape
- Adobe Illustrator (kommerziell)
- Corel Draw (kommerziell)
- OpenOffice Draw
- Batik
- Siehe auch: XMLEditing
SVG die ersten Schritte
- Koordinatensystem
- X-Achse waagerecht vom linken Bildrand nach rechts
- Y-Achse senkrecht vom oberen Bildrand nach unten
- Elemente
- Rechteck
- Text, auch Fließtexte
- Bezierkurven
- Kreis, Ellipse, Bogen
- Pfad
- Pfeilspitzen ????????
Beispiel für einen Pfad
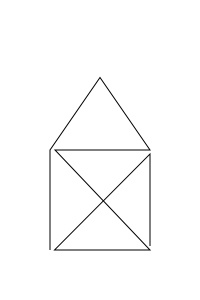
Pfad aus "M" (=move to) und "L" (= line to):
<?xml version="1.0" encoding="UTF-8" standalone="no"?>
<svg xmlns="http://www.w3.org/2000/svg" version="1.0"
     width="200" height="300">
  <path stroke="black" stroke-width="1px" fill="none"
     d="M 50,250 L 50,150 L 100,77.5 L 150,150 L 55,150 L 150,250 L 54.5,250 L 150,154 L 150,246"/>
</svg>
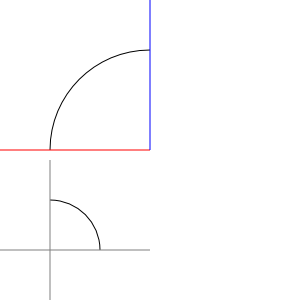
Beispiel für Bogenstücke
<?xml version="1.0" encoding="UTF-8" standalone="no"?>
<svg xmlns="http://www.w3.org/2000/svg" version="1.1" width="300" height="300">
<g stroke="black" stroke-width="1" fill="none">
<path d="M150 50 A100 100 0 0 0 50 150" />
<path d="M0 150 L150 150" stroke="red"/>
<path d="M150 0 L150 150" stroke="blue" />
<path d="M50 200 A50 50 0 0 1 100 250" />
<path d="M50 160 L50 300 M0 250 L150 250" stroke="gray"/>
</g>
</svg>
Beispiel für zwei einzelne Textzeilen
<?xml version="1.0" encoding="UTF-8" standalone="no"?>
<!DOCTYPE svg PUBLIC "-//W3C//DTD SVG 1.0//EN" "http://www.w3.org/TR/2001/REC-SVG-20010904/DTD/svg10.dtd">
<svg xmlns="http://www.w3.org/2000/svg"  width="265" height="65"
     xml:space="preserve" color-interpolation-filters="sRGB" fill="none">
	<title>Balanced Scorecard</title>
	<desc>Aus:  pres_030806.ppt TTC</desc>
	<style type="text/css">
		.st2 {fill:rgb(0,103,171);font-family:Verdana;font-size:20pt;font-style:italic;font-weight:bold}
	</style>
	<g>
                <rect x="1" y="1" fill="none" stroke="black" width="264" height="64"/>
		<text x="18" y="29" class="st2">Basic Balanced</text>
		<text x="50" y="55" class="st2">Scorecard</text>
	</g>
</svg>


